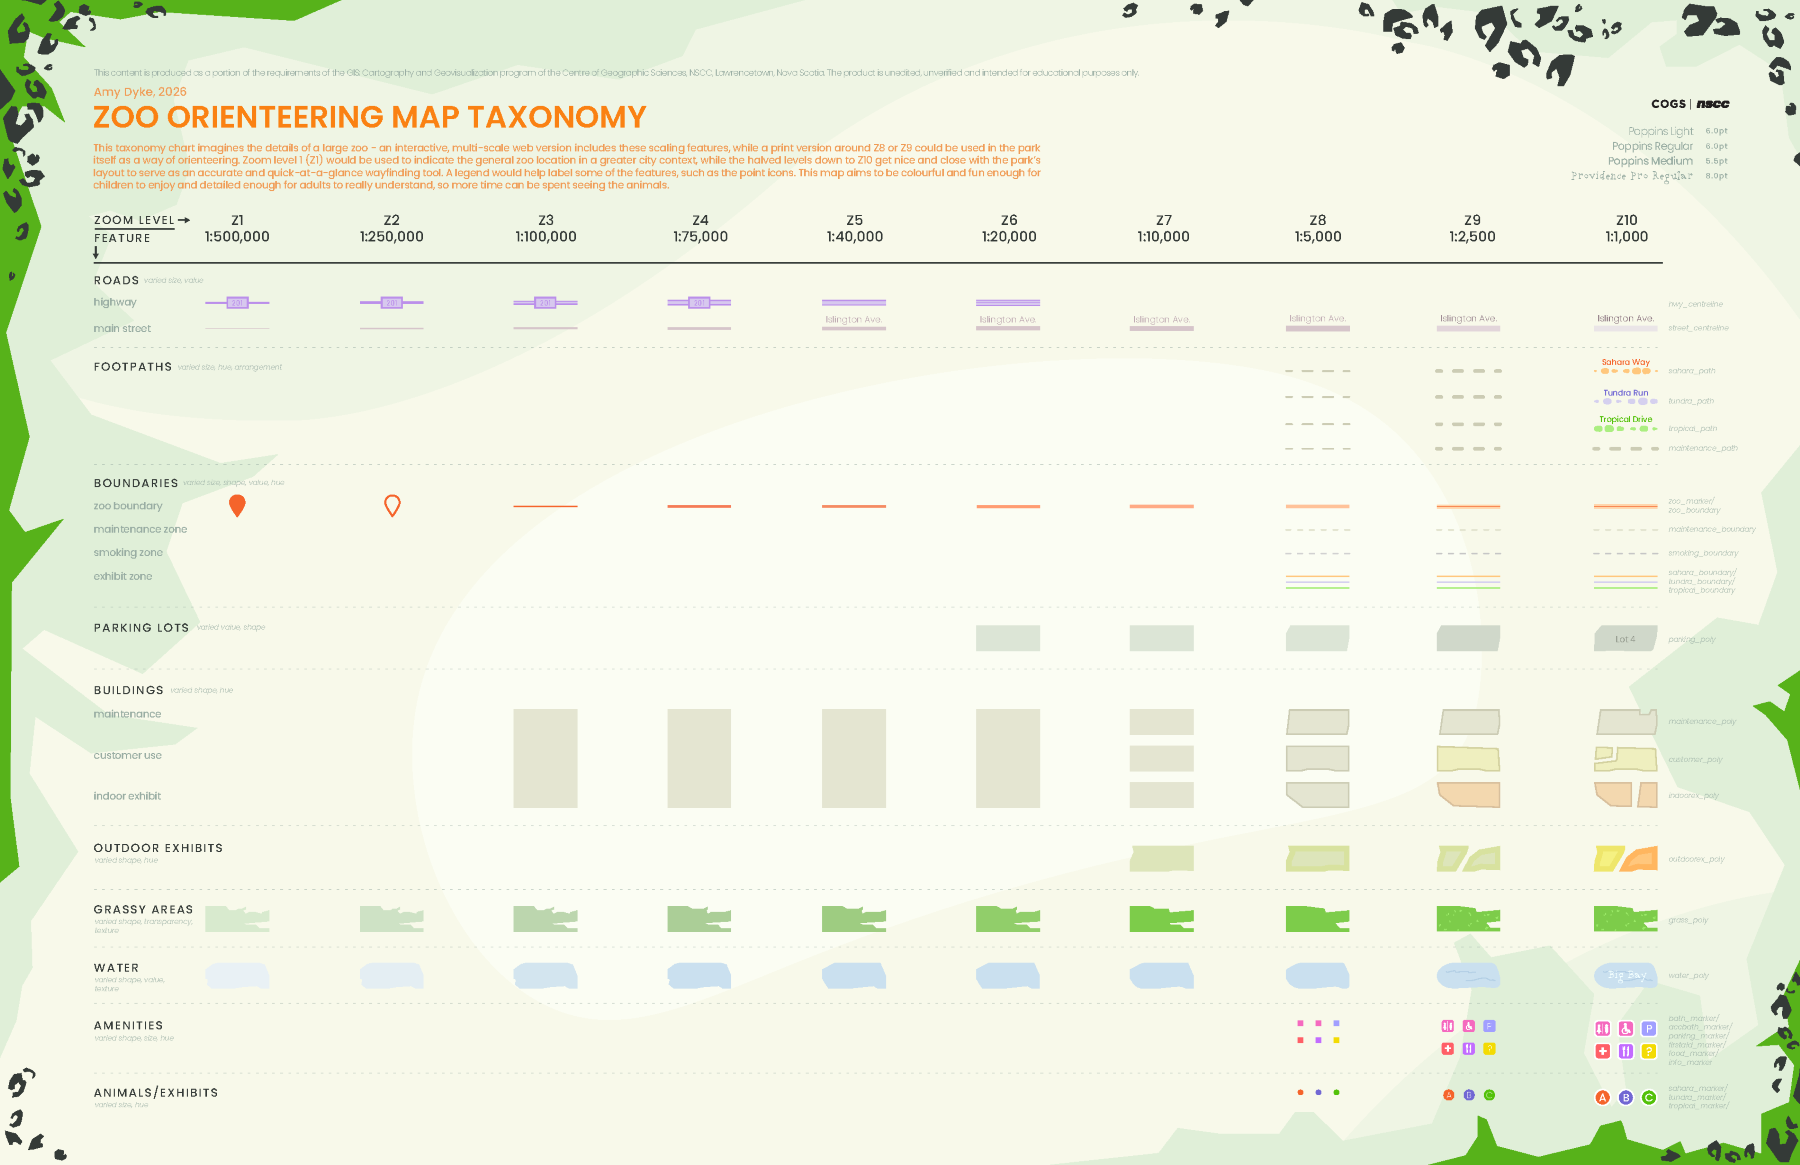
Multiscale Symbol Taxonomy
This map taxonomy chart imagines a zoo as the setting of a web map these features are made for. The taxonomy chart demonstrates what the features would look like at different zoom levels from a small scale of 1:500,000 to a large scale of 1:1,000. As the map user zooms inwards, information becomes more visible, refined, or appears altogether. This ensures the map does not suffer from information overwhelm at small scales and that the web map runs smoothly and is operable, accessible, and accurate. The taxonomy chart itself becomes an excellent organizational tool to improve efficiency and effectivity of project workflow.
Key Skills
- Illustrated custom point icons in Adobe Illustrator that consider variations in shape, size, and hue to help depict specific locations for a map centred around points of interest.
- Drafted line features at varying scales, considering principles of line weight, value, and pattern as essential characteristics for communicating changes in information.
- Modelled example polygon features through varied transparency, pattern, hue, and replicated generalization techniques including aggregation and simplification to reduce excessiveness at small scales.
Software
- Adobe Illustrator