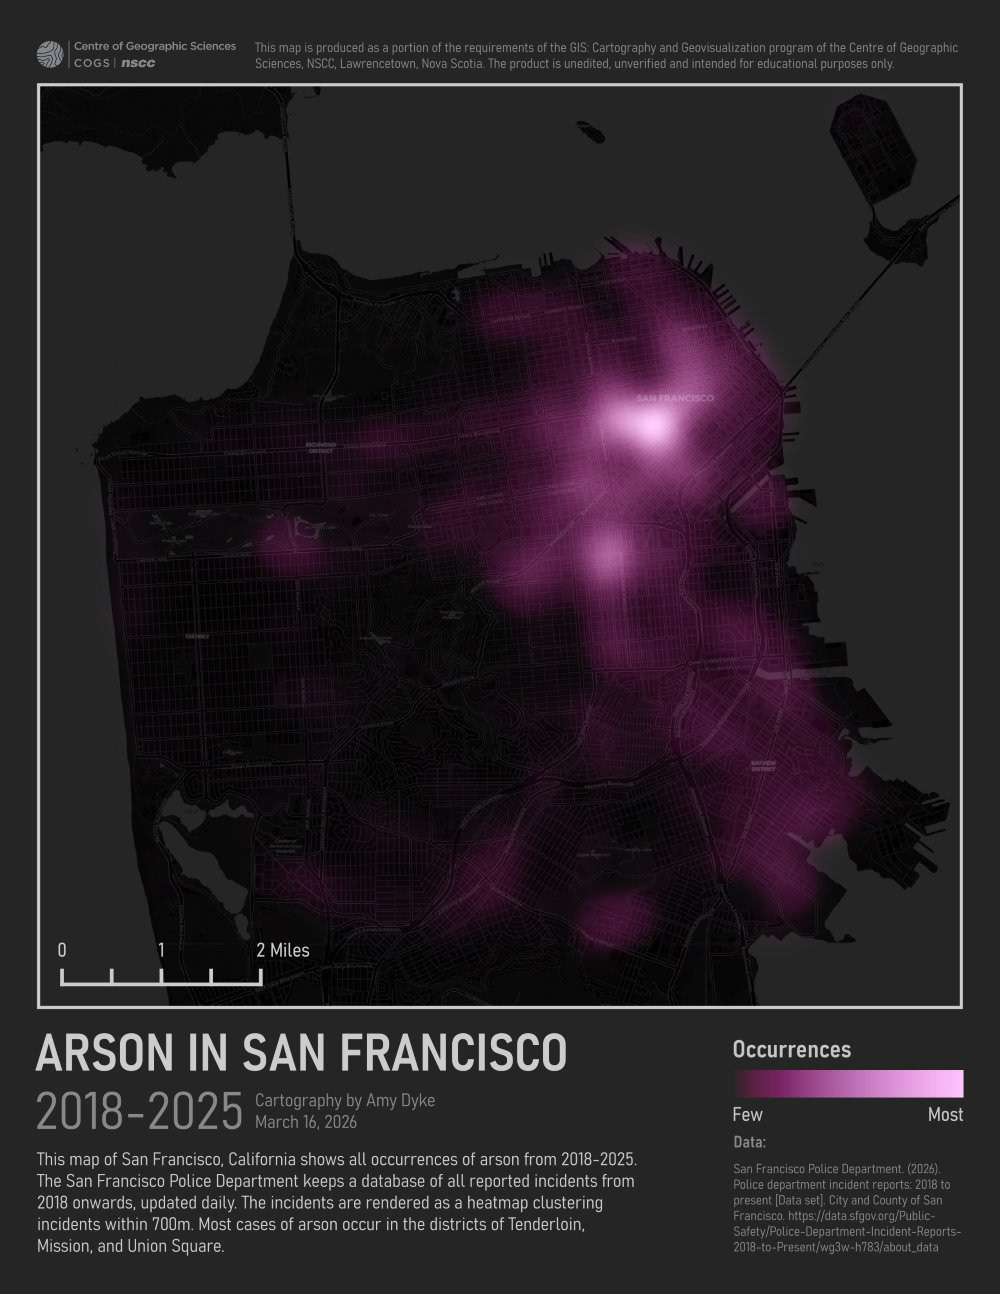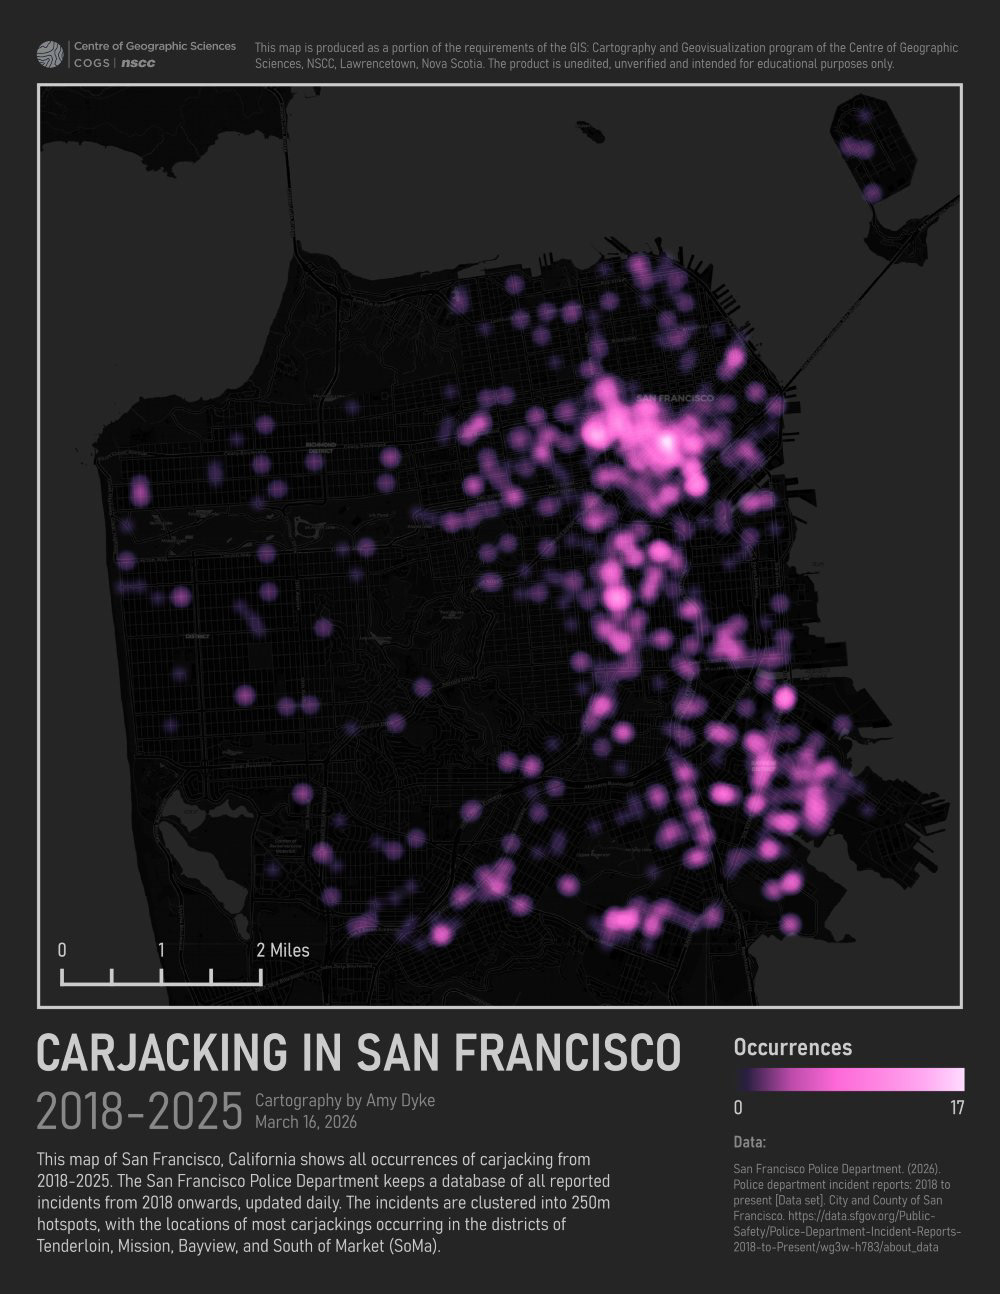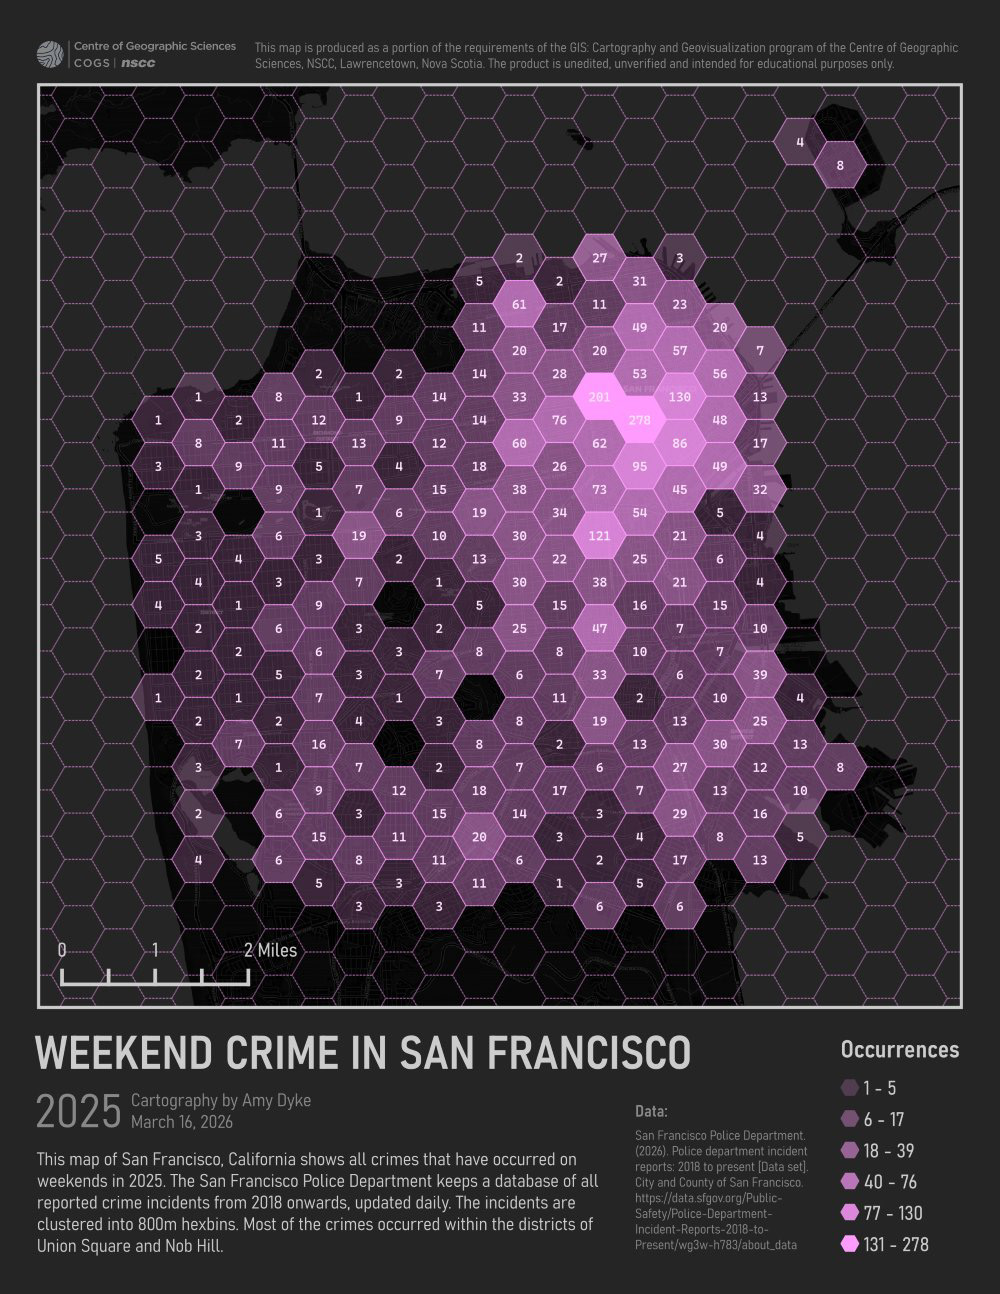
Hotspot, Heatmap, Hexbin
These three maps show H3 geospatial visualizations of San Francisco crime data. They were completed entirely in the free and open-source GIS, QGIS, and drafted as layouts to help show trends and patterns across the data.
Key Skills
- Transformed hundreds of thousands of data records using data reduction strategies such as cleaning, filtering, and subsampling to mitigate against geoprocessing failure while maintaining essential information and data integrity.
- Stylized point data using advanced symbolization techniques that generalize and simplify the distribution of phenomena to preserve spatiality while highlighting trends.
- Analyzed data through geo-visual representations to identify patterns, trends, and relationships and present an opportunity for the data story to be displayed.
Software
- QGIS
- Microsoft Excel