
Creative Cartography
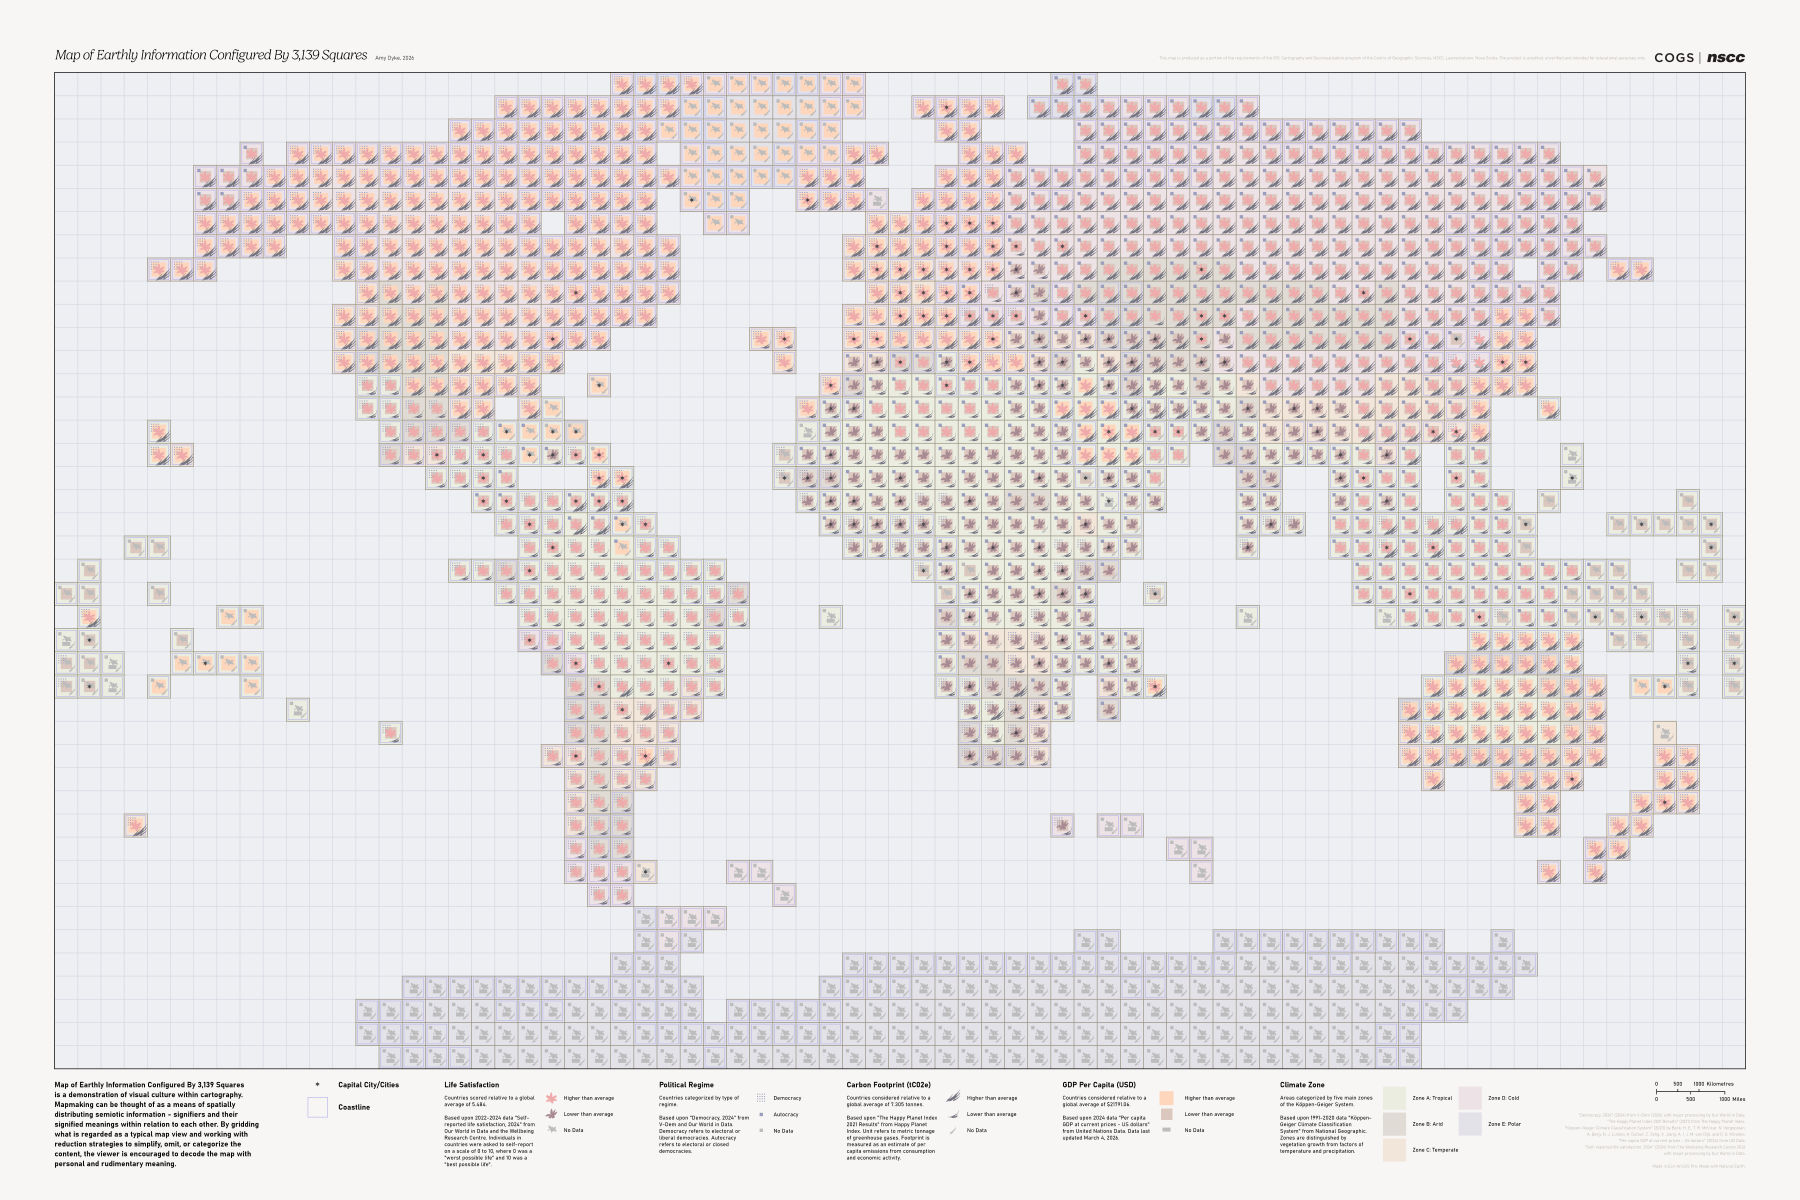
This large format poster titled “Map of Earthly Information Configured By 3,139 Squares” is a several week-long endeavour in combining Geographic Information Systems with fine art and visual culture concepts. Data on global indicators was prepared, edited, and spatially distributed into squares or “bins”. Each symbol represents one data characteristic and is layered with the rest of that geographic area’s symbolized characteristics to paint a generalized pattern of the world. The final image is intended as a 3 X 2 ft print.
Key Skills
- Prepared global data for cartographic representation through collection, cleaning, and record matching, displaying key indicators of countries that describe thematic relationships and patterns between locations.
- Performed geoprocessing and data manipulation techniques in ArcGIS Pro using Definition Queries, Spatial Joins, Tessellations, and the Field Calculator with Python expressions to generalize information for display while maintaining data integrity.
- Developed icons in Adobe Illustrator, paying specific attention to troubleshooting colour discrepancies, differences in contrast, and visual variable theories to achieve visual harmony across all layered symbol combinations.
Software
- ArcGIS Pro
- Adobe Illustrator
- Microsoft Excel
Description on image reads:
Map of Earthly Information Configured By 3,139 Squares is a demonstration of visual culture
within cartography. Mapmaking can be thought of as a means of spatially distributing semiotic
information - signifiers and their signified meanings within relation to each other. By
gridding what is regarded as a typical map view and working with reduction strategies to
simplify, omit, or categorize the content, the viewer is encouraged to
decode the map with personal and rudimentary meaning.